
|
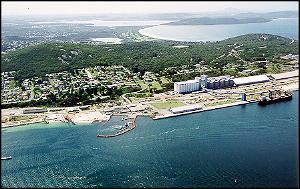
Princess Royal Harbour nutrient audit |
Although information is not comprehensive, there is sufficient monitoring to indicate general trends and the relative importance of different nutrient sources.
A word of caution is that new monitoring in 2001 has confirmed Hanrahan Road Tip is a major exporter of nitrogen. Monitoring by the City of Albany in 2001 estimates 9,759 kilograms of nitrogen and nine kilograms of phosphorus was exported by the tip into the Woolstores Drain. The drain's impact on the harbour has to date not been monitored, and suggests nitrogen input to the harbour has been significantly underestimated.
Vital Foods
Nitrogen export from Vital Food was 1.46 tonnes in 2001, compared with 2.89 tonnes in 2000. Phosphorus declined from 2.71 tonnes in 2000 to 580 kg in 2001. These reductions can in part be explained by a large reduction in potato (chip) production, from 1163 tonnes in 2000 to 314 tonnes in 2001. However, pea production increased from 340 tonnes in 2000 to 1436 tonnes in 2001, and the dramatic reduction in nutrients is not fully explained by the levels of production. Reported spillages and bypassing of metered discharges could account for part of this reduction, along with the introduction of a steam (rather than mechanical) peeler in the potato production, which has reduced the amount of waste material.Nutrient concentrations were generally consistent with previous years. Phosphorus levels did not have the high peaks associated with past years, which could be explained by the new method of potato peeling.
Effluent from Vital Food is still dominated by the quantity of produce and the type of produce (potatoes and peas being the major source of nutrient export). Production in 2002 has already contributed to higher levels of nutrients than in 2001, as a result of increased potato production.
CSBP Wesfarmers Ltd
Discharge from CSBP is via treated stormwater into Munster Hill Drain. The levels of contamination are affected by the level of truck deliveries of fertiliser and the severity of rainfall events. The nutrient export rates over recent years show links with the level of rainfall and amount of fertiliser transported through the site.Phosphorus export has been very low since 1993, and is well within the EPA recommended levels.
Nitrogen export in 2001 was 1.92 tonnes, which is approximately two thirds of the export rate in 2000. A reduction in rainfall may have assisted with this reduction, along with improved management practices and changed frequency of loading/unloading activities.
CSBP are discussing the option of connecting to sewer with the Water Corporation. This connection might occur with the extension of sewerage to Little Grove, planned for 2004/2005.
Princess Royal Seafoods
Princess Royal Seafoods connected to sewer in June 2001. No records exist of discharge between January-June 2001, and therefore in this audit the effluent levels and characteristics were assumed to be the same as for January-June 2000.Princess Royal Seafoods ceased trading in 2001, but the plant is still managed by Austral Fisheries as a fish processing plant. With connection to sewer the industry is no longer a source of nutrients entering the harbour. A major source of visual pollution (through discharge of fish blood) and the biggest single source of oil and grease has now been removed.
The Albany Drainage District consists of Robinson Road Drain and Munster Hill Drain, the later servicing a catchment which includes CSBP, an industrial area, semi-urban and urban properties.Both drains saw a reduction in flow in 2001 of the order of 25%. This is likely to have been a consequence of reduced rainfall and a changed rainfall pattern.
Phosphorus and nitrogen discharge levels from Robinson Road Drain roughly matched the reduction in flow. Nitrogen fell from 2.71 tonnes in 2000 to 2.28 tonnes in 2001. Phosphorus fell from 0.21 tonnes in 2000 to 0.12 tonnes in 2001.
Munster Hill Drain saw a much greater reduction in nitrogen. Nitrogen levels fell from 7.28 tonnes in 2000 to 2.97 tonnes in 2001. However, phosphorus increased from 0.41 tonnes in 2000 to 0.56 tonnes in 2001. These changes are difficult to interpret, but a reduction in nitrogen can be partly explained by the changed level and pattern of rainfall, along with reduced inputs from CSBP. The saleyards were also dismantled and the ponds partially cleaned out in 1999.
Nutrient inputs from both groundwater and urban stormwater are sourced from historical studies, and are not monitored on an annual basis given the costs and technical difficulties involved. For groundwater, annual large fluctuations are not expected, and two studies have been undertaken to identify nutrient export rates.Urban stormwater has not been monitored since a study by the Town and Shire in 1992/93. Annual fluctuations are expected, but not recorded in this audit. Monitoring of targeted catchments would be of value to gain a greater insight into the scale of these annual fluctuations.
Monitoring started in 2001 has confirmed that Hanrahan Road landfill site is a major exporter of nitrogen. The City of Albany's monitoring in 2001 produced surface water export levels of 9759 kg of nitrogen, which is approximately half the existing monitored nitrogen input to the harbour from all other sources.The drain downstream of Hanrahan Road landfill site is presently not monitored. It is suggested this be monitored from 2003, to determine the level of nutrients entering the harbour from the landfill site.
The monitoring highlights the need for changed management practices at the landfill site.
Management practices at the landfill site need to be amended to reduce nitrogen export, and monitoring of the Woolstores Drain undertaken to determine impacts on the harbour.
Both phosphorus and nitrogen export from Vital Food remains above EPA load targets. Nitrogen levels from CSBP are also above the EPA's recommended concentration levels. Connection to sewer is planned for both industries, and needs to be progressed.
Urban stormwater would benefit from more detailed investigation, to check accuracy of 1993 studies and to investigate annual fluctuations.
     
|
 |
 |
 |
|
|
 |
|
|
|
|
 |
|
|
|
|
 |
| Industry | Phosphorus | Nitrogen | ||
|---|---|---|---|---|
| Load | Concentrations | Load | Concentrations | |
| Vital Food | 3 | 8 | 3 | 8 |
| Wesfarmers-CSBP | 3 | 3 | 3 | 8 |
| Princess Royal Seafoods* | 3 | 8 | 8 | 8 |
Note: These figures can also be viewed as tables.


