(Source: Bott, G. M. 1991, cited in South Coast Estuaries Project Group,1991)
Catchment clearing
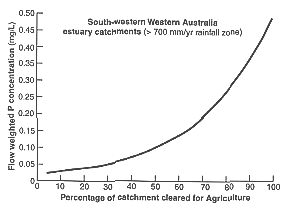
Investigations into the coastal catchments of estuarine systems of south-western Western Australia have shown that there is a strong link between the percentage of catchment cleared and the nutrient loss from a particular catchment. Nutrient loss increases exponentially with an increase in the percentage of catchment cleared.
| Catchment | Subcatchment | Total area (ha) | Area of private bush (ha) | Area of reserves (ha) | Area of cleared private land (ha) | % of private land cleared | % of catchment cleared | *Drainage density (m/ha) |
|---|---|---|---|---|---|---|---|---|
| Princess Royal Harbour | Robinson Drain | 689 | 29 | 36 | 625 | 96 | 91 | 5.5 |
| CSBP | 675 | 25 | 75 | 575 | 96 | 85 | ? | |
| Albany town | 472 | 72 | 169 | 231 | 76 | 49 | ? | |
| PRH | 6515 | 1796 | 3198 | 1521 | 46 | 23 | 18 | |
| 8351 | 1922 | 3478 | 2952 | 61 | 35 | 14.5 | ||
| Oyster Harbour | King | 16805 | 308 | 280 | 16217 | 98 | 97 | 8.1 |
| Mill Brook | 16224 | 921 | 1591 | 13713 | 94 85 | 7.3 | ||
| Upper Kalgan | 202719 | 16156 | 52723 | 133840 | 89 | 66 | 8.2 | |
| Lower Kalgan | 41852 | 3777 | 1166 | 36909 | 91 | 88 | 6.2 | |
| North Oyster | 8683 | 1820 | 777 | 6087 | 77 | 70 | 8.9 | |
| Chelgiup | 5055 | 759 | ? | 4297 | 85 | 85 | 4.8 | |
| Willyung | 3404 | 103 | 254 | 3047 | 97 | 90 | 10.7 | |
| Johnston Creek | 6193 | 1282 | 1722 | 3189 | 71 | 51 | 4.2 | |
| Yakamia | 2133 | 78 | 301 | 1778 | 96 | 82 | 7.8 | |
| Albany town | 1024 | ? | ? | ? | ? | ? | ? | |
| 304092 | 25204 | 58814 | 219077 | 90 | 72 | 7.7 | ||
* includes twice the length of road as an estimate of road drains, but does not include farm and paddock drains
? unknown
(source: South Coast Estuaries Project Group 1991)
|
(Source: Bott, G. M. 1991, cited in South Coast Estuaries Project Group,1991) |
The health of a waterway is very much influenced by the health of its fringing vegetation.
This is a problem for the Albany harbours. To stop more nutrients gettings into the harbours, clearing needs to stop in the catchments and more work needs to be done to restore vegetation.
Currently, AgWA assesses land clearing applications under the Soil and Land Conservation Act. Under the Act landowners who want to clear one hectare or more must give AgWA a `Notice of Intention to Clear'. AgWA's assessment of these applications is carried out according to guidelines for clearing on the South Coast. The guidelines only prevent clearing when it would result in land degradation or eutrophication of waterways. This rule has been set under the Soil and Land Conservation Act.
To reduce the chance of nutrient-rich run off entering a waterbody, the guidelines recommend that a buffer strip of natural vegetation should be left along each side of inlets, rivers and creeks. The guidelines also suggest not clearing areas that are susceptible to land degradation problems such as wind and water erosion, high salinity and water logging.
| Waterbody | Buffer Zone |
|---|---|
| Inlets | 75 m buffer to be left from the natural vegetation line |
| Rivers | 50 m buffer to be left from the natural vegetation line (rivers are defined as all permanent watercourses marked on 1:50000 map) |
| Creeks | 25 m buffer to be left from the natural vegetation line, (creeks are defined as all permanent water courses too small to be marked on 1:50000 map) |
Since 1990 the Oyster Harbour Catchment Group, AWMA and AgWA have researched the condition of the major waterways and their fringing vegetation. Original studies by Dr Luke Penn surveyed the Kalgan River in 1992-93. In 1997 a survey of the King River and major tributaries of the Kalgan River were done. The surveys findings are available to land owners and landcare groups. The information is used to work out priorities for helping with fencing along the waterway, weed control and other rehabilitation work.
The protection of fringing vegetation by getting rid of weeds and putting up fencing to keep stock out of foreshore areas is vital to keep banks stable, prevent erosion and reduce nutrient input to the rivers and harbours.