Nutrient enrichment of the harbours
Nutrients come from three main sources: industrial, urban and rural.
Industrial pollution has been the major source of pollution in Princess Royal Harbour. Nutrients from industry are discharged directly into the harbour waters through effluent outfalls. They also get in indirectly with surface run off and through groundwater. The studies by the Environmental Protection Authority in 1988-89 found five main industries directly discharging into Princess Royal Harbour. Of them, four are still discharging (at May 1998), although with reduced pollution loads.
The discharging industries:
Nutrients from urban areas affect Princess Royal Harbour and, to a lesser extent, Oyster Harbour. Urban sources include groundwater leaching from septic tanks and run off (with nutrients from garden fertilisers) from stormwater drains.
A number of point sources of nutrients also exist within the urban area including rubbish tips, gardens, roads and recreation grounds. Nutrients from these sites enter the harbours through stormwater drainage and through groundwater leaching.
|
Rural nutrient sources originate mainly from agriculture. Point sources have been identified by Agriculture Western Australia, including sewerage works or night soil, rubbish tips, piggeries, dairies, abattoirs, horticulture, saleyards and feedlots. Diffuse sources are mainly from fertiliser washed off farms by run off or leached into the groundwater, or eroded from river banks. The fertiliser reaches the harbours through rivers, streams and creeks. These sources are especially important in high rainfall years because a lot more soil and fertiliser is washed into the waterways.
Nutrient levels are a good way of working out the health of the Albany waterways. High levels of nutrients are responsible for algae growth and the consequent limiting of seagrass growth or recovery. As a result of the EPA's research and recommendation, since 1991 AWMA has coordinated monitoring nutrients entering the harbours. The actual task of monitoring is spread over a number of State and local government agencies, the foreshore industries and community and Landcare groups. Involvement of so many organisations reflects the different types of nutrients entering the harbours and the different geographical conditions they come from.
The continued monitoring of nutrient levels is essential to help find out if actions to reduce the amount of nutrients coming into the waterways are working. The selective monitoring of individual river catchments, drains, particular land uses and industries can identify the main sources of nutrients and lead to effective nutrient management.
Existing pollution control licences issued by the Department of Environmental Protection (DEP) require existing foreshore industries to regularly monitor their nutrient discharge into the waterways.
Agriculture WA monitors nutrient levels in rural catchments and is preparing strategies to reduce nutrient loads from agriculture.
The results of monitoring are used to produce an annual nutrient audit for the EPA.
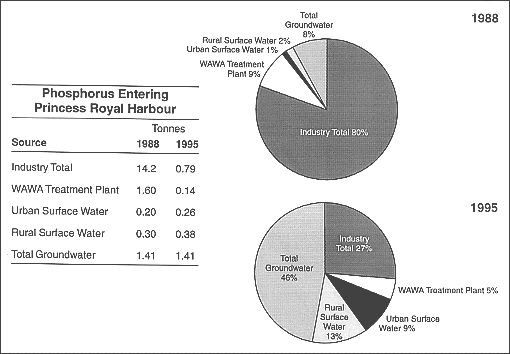
Figure 9-2: Phosphorus loads to Princess Royal Harbour 1988-95
The audit showed that 2,983 kg of phosphorus and 21,912 kg of nitrogen were discharged into Princess Royal Harbour in 1995, compared with the EPA's target figures of 7,140 kg and 19,980 kg respectively. The results are better than previous years and are the lowest level of phosphorus discharged to the harbour during the last 30 to 40 years. The increased reduction in phosphorus and nitrogen levels in 1995 was owing largely to the closure of the Point King sewage treatment plant. This alone resulted in a reduction of 1.5 t of phosphorus and just under 5 t of nitrogen.
However, industry's contribution to the nutrient levels to the harbour increased during 1995, a result of greater production at Vital Food and the establishment of Princess Royal Seafoods.
Although this increase was predicted in the 1994 audit, it's a matter of concern because it showed that discharge loadings are still largely influenced by production levels rather than management controls. Nitrogen levels were recorded above the EPA's target figures, with CSBP, Vital Food, Princess Royal Seafoods and the collective urban-rural surface and sub-surface drainage still exceeding their individual target figures.
Phosphorus discharge levels into the harbour have declined steadily. This has been mostly because phosphorus discharged by CSBP has fallen from 8.1 t in 1988 to only 6 kg in 1995.
Other significant and long-term reductions in phosphorus levels have happened because Metro Meat closed in April 1993 and the King Point sewage treatment plant closed in January 1995. The closure of Metro Meat, together with the reduction from CSBP, has reduced the amount of phosphorus coming from industry into Princess Royal Harbour from 80% in 1988 to 26% in 1995.
A decline in nitrogen levels has also been recorded because of the improvements made by CSBP and the closure of Metro Meat. Annual variations are also influenced by changes in industrial production levels and rainfall flows (for rural surface water), which suggests there is little increased control on nitrogen use or loss from these sources.
 |
Compiled from data supplied by courtesy of the Water Corporation of Western Australia, Agriculture Western Australia and the Water and Rivers Commission |
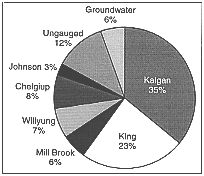
Oyster Harbour is a more complex system than Princess Royal Harbour. Oyster Harbour's nutrient loads are highly dependent on flow from the King and Kalgan rivers. The 1995 Nutrient Audit for Oyster Harbour included monitoring six subcatchments of the harbour: the King and Kalgan rivers; Mill Brook; and Chelgiup, Willyung and Johnston creeks.
| Nitrogen (tonnes) | Phosphorus (tonnes) |
|
|---|---|---|
| Princess Royal Harbour | < 13.5 | < 4.6 |
| Oyster Harbour | < 107.9 | < 13.9 |
Table 9-2: Target loads for industry and diffuse source nutrient inputs to Princess Royal Harbour
| Nitrogen (tonnes) | Phosphorus (tonnes) |
|
|---|---|---|
| Industry | < 5.98 | < 2.14 |
| Diffuse source | < 0.65 | < 0.4 |
The audit included gauged data from the above catchments and an estimation of discharge from the ungauged part of Oyster Harbour. The ungauged discharge estimate was calculated assuming that discharge is about 1.8 times that of the discharge from Chelgiup Creek. Loads were estimated by the ratio of estimated discharges for the ungauged portion in 1995 to 1993 and applying this ration to the load estimate in 1993.
The total discharge from the catchment into the harbour in 1995 was estimated at 60.7 million cubic metres. The total phosphorus load was estimated to be 6.7 t. The King River contributed about 25% of this.
The total nitrogen load was estimated at 67.9 t. The largest inputs came from the Kalgan River (25.8 t) and the King River (17.2 t).
The Albany Harbours Environmental Study defined the 'nutrient assimilative capacities' of Princess Royal Harbour and Oyster Harbour. These capacities are the ability of a waterbody to disperse, dilute or absorb certain wastes without long-term damage to its plants and animals. The assimilative capacity depends on the physical and biological characteristics of the waterbody and the type of wastes which are discharged into it.
The study indicated that for Princess Royal Harbour a maximum of 7 t of phosphorus and 54 t of nitrogen per year could be absorbed by the system and still keep algae at an acceptable level.
Oyster Harbour is a more complex system because of the flow from the Kalgan and King rivers. The nutrient assimilative capacities of the Oyster Harbour were significantly higher in above-average rainfall years. They could be double below-average rainfall years. This is because a higher percentage of the sediment and nutrients would be carried out of the harbour into King George Sound. The study showed that a range of between 7 and 14 t of phosphorus and between 54 and 108 t of nitrogen could be assimilated by Oyster Harbour.
The Albany Harbours Study also showed that nutrient loads to both harbours were much greater than their assimilative capacities. Immediate and substantial reductions in nutrients from all sources were needed to stop the harbours deteriorating further. Recommendations were made to reduce nutrient loads to target figures set by the EPA. These included a reduction of annual rural nutrient loads to Princess Royal Harbour to < 13.5 t of nitrogen and < 4.6 t of phosphorous. Target rural nutrient loads for Oyster Harbour were set at < 13.9 t of phosphorus and < 107.9 t of nitrogen.
To reduce nutrient levels to assimilative capacities the Albany Harbours Environmental Study made a number of assumptions. The study recommended that further investigations to refine initial estimates of the annual assimilative capacities of Oyster Harbour, in particular, be carried out by the Albany Waterways Management Authority.
Since the EPA's Bulletin 442, which contained the results of the study, was released the value of assimilative capacity has been increasingly questioned. Today, target figures are aimed at achieving the lowest pollution levels using `best management practices' and the resources and technology available.
The Albany Harbours Environmental Study made a number of recommendations about reducing nutrients entering the harbours. AWMA is currently responsible for administering these recommendations and is encouraging other organisations to ensure they're carried out. The recommendations included the following actions:
Investigations have shown that removing the sediments from the floors of the harbours is impractical because it would damage seagrass beds and disturb sediments and nutrients, prompting further algae growth.
Currently there are four major harbour industries licensed under the Environmental Protection Act to discharge their wastewaters into Princess Royal Harbour. Pollution control assessment and monitoring is controlled through powers from the Environmental Protection Act. AWMA advises about licences.
The Albany Harbours Environmental Study recommended reducing nutrient loads from the four industries by March 1992. The study set limits on the effluent concentration discharged into Princess Royal Harbour.
| Measure | Amount |
|---|---|
| Biochemical oxygen demand (BOD) | < 20 mg/L |
| Total suspended solids (TSS) | < 80 mg/L |
| Oil and grease | < 30 mg/L |
| Total nitrogen (TN) | < 10 mg/L |
| Total phosphorous (TP) | < 3 mg/L |
In response to these limits CSBP carried out an effluent and solid waste disposal study and prepared a management plan for the disposal of effluent from their Albany works. Following this study upgrading of their facilities to meet the requirements of the EPA was carried out.
In 1992, Albany Woollen Mills (now the Albany Spinning Mills) became the first of the industries to meet the phosphorus and nitrogen target loads set by the EPA. The company also installed new effluent monitoring equipment to accurately measure discharge volumes.
At this time the Western Australian Government suggested the development of an Albany Centralised Wastewater Facility to which all industries would discharge their wastes for treatment. It was soon realised that such a facility would not be practical because of the differences in each industry's wastewater. The Government then extended to March 1993 the date by which industries had to comply with the effluent discharge levels.
The Government also conducted a review of the effluent and treatment options available to the industries in Albany in order to achieve the EPA's target concentrations and loads. Following this review the Government adopted an industrial control strategy to reduce nutrient input from all of the industries discharging into the Albany harbours. The strategy focused on reducing phosphorus input to the harbours and provides cost-effective water treatment options.
In 1995 AWMA reviewed each industry's wastewater and recommended how their licences should be changed. The recommendations were taken up by the Department of Environmental Protection and the Environmental Protection Authority and the industry's licences were changed to introduce, for the first time, pollution levels consistent with the levels recommended in the EPA's Bulletin 442 in 1990.
Since 1997 the four industries have introduced wastewater treatment methods which are, to various degrees, meeting the EPA's levels.
Other small industries are located around Albany and within the catchment area. The majority of these aren't licenced because of their size, but together they can add a lot of nutrients to the harbour. These industries are checked at random and occasionally monitored so that the results can be used to guide management. Effluent treatment and disposal methods for these industries need to be assessed and upgraded where necessary to reduce the amount of nutrients going into the harbours.
New industrial areas need to be designed to lessen nutrients getting into the waterways. This may include connection to sewerage, better drainage design, requirements for site maintenance and the use of certain technologies as a condition of development approval.
The Albany Harbours Environmental Study recommended that the Town and Shire of Albany develop programmes to reduce nutrient loads to the harbours from both point and diffuse sources in the urban area. Both the Town and Shire have occasionally carried out monitoring programmes.
Within the Town of Albany 18 drains collect run off from a catchment of 235 hectares. Urban run off contains significant quantities of nitrogen and phosphorus from a number of sources including garden fertilisers and the decomposition of organic matter. Also, significant amounts of bacteria and low concentrations of heavy metals and pesticides can be carried in this run off.
The Town of Albany has about 120 microcatchments, each of which has a stormwater outlet which can be used for sampling a particular catchment. The Town has monitored a number of these outlets. The results of the sampling were used to work out nutrient loss from the other catchments as well, based on the catchment size, land use and rainfall.
To date, the Town of Albany has researched the most appropriate monitoring techniques and learned about the movement of nutrients, soil hydrology and the technology needed to contain pollutants. This has involved contacting other councils, government departments and research institutions.
The town has monitored diffuse sources. In 1991, 13 sites were monitored after eight storms with a total of 128 samples collected. Analysis was undertaken for total nitrogen and total phosphorus.
The Town of Albany has also identified point sources within the urban area. These include:
The results of the monitoring by the Town and the Shire can be found in reports (Town of Albany (unpub.); Shire of Albany (unpub.)) listed in the Further reading section of this book.
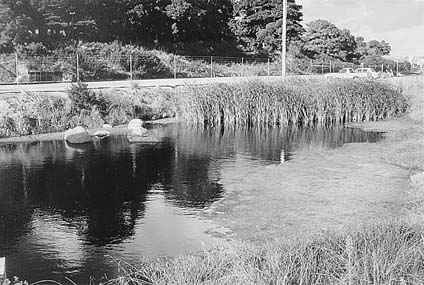
Stormwater ponds can help to prevent nutrients and pollutants from entering the waterways
The Albany Harbours Environmental Study recommended that Agriculture Western Australia (AgWA) look at areas within the catchment that contributed a lot of phosphorus, and work out a way of managing them better. The promotion and adoption of catchment management plans was also recommended.
In response, AgWA established the South Coast Estuaries Project Group. The group's main research was identifying the nutrient status of soils, management practices and attitudes of farmers, and point sources within the catchment. From this information catchment management strategies were identified to reduce nutrient loads to the harbours.
In 1988 and 1989 soil surveys were done on 309 farms within the catchment. The goal was to find out what sort of, and how many, nutrients were in the soils of the catchment and identify areas that were likely to lose lots of nutrients. The survey results were given to the farmers involved and they were then invited to discuss fertiliser application rates with AgWA advisers. The main findings of the soil survey were:
Since the survey was carried out about 50% of the farmers who participated have reduced their fertiliser application rates.
In 1990 further soil sampling was carried out by the group. Fifty farms were sampled. In 1991, 40 out of the 50 farmers who had their soil tested spoke to AgWA about their fertiliser strategies. The general feeling from these discussions in 1991 was that there was a more genuine interest in reducing fertiliser use (and reducing the movement of nutrients into the harbours) among farmers. It seems that the soil testing programme is raising awareness among farmers and will in the long term result in less nutrients going into the harbours.
The group also monitored major streams and rivers flowing into the Albany harbours. In 1991 13 gauging sites were monitored within the Albany harbours catchment area. Some sites were established and monitored in conjunction with schools. Each site was monitored for water flow, sediment concentration and soluble and total phosphorus concentrations.
The results obtained from monitoring showed a wide range in total and soluble nutrient and sediment loss from the catchments. The 1991 monitoring highlighted a number of important aspects of nutrient monitoring: These are listed below:
The 1992 monitoring programme was similar to that of 1991. A few additional monitoring activities were added. These included monitoring of leaching and run off losses of nutrients on small-scale trial plots, and monitoring of the Kalgan River.
Monitoring is still underway (at May 1998) to see how many nutrients get into Oyster Harbour. Monitoring is also still being done to work out how valuable fringing vegetation is for reducing the speed of erosion and stopping nutrients being carried into waterways. Monitoring is used more and more to see what effect particular land uses and landcare practices have on a waterway.
AgWA is the leading agency in catchment and landcare issues and gives advice to catchment groups to encourage the sustainable use of agricultural land. This work is increasingly being focussed on subcatchments because people who live in the area are very interested and keen to get on with plans and practical work.
The Oyster Harbour Catchment Committee is made up of all the Landcare District Committees (LCDCs) in the Oyster Harbour catchment. The committee encourages catchment plans, which have led to more rehabilitation programmes.