
|
Pallinup River |
| Pallinup River at a glance | |||
| Catchment area: | 4795 square kilometres |
||
| Average annual catchment rainfall: | 400-600 millimetres | ||
| River length: | 250 kilometres | ||
| Annual discharge into Beaufort Inlet: | 24.8M cubic metres | ||
| Percentage catchment cleared: | 90% | ||
| River health: | Highly saline | ||
| Data selection | |||
|
|
|
|
|
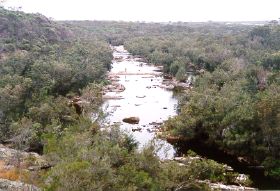
The Pallinup River catchment has been cleared mainly for cereal production and sheep grazing. Most of the land north of the Stirling Range National Park is cleared, however there still is a considerable areas of uncleared bush along Corackerup Creek and the Corackerup Nature Reserve, and the immediate vicinity of the estuary. The annual average flow of the Pallinup is 24,800 megalitres - making the Pallinup one of the major rivers on the south coast.
The Pallinup River system and internal drainage lines of the Pallinup-North Stirlings have sections that are in good condition however many sections in the upper catchment are generally in a very poor state. Stream sections that could be considered outstanding are the upper reaches of the Monjebup Creek, Corackerup Creek, Peenebup Creek and Pendenup Creek and sections of the Pallinup River from Borden to the Beaufort Inlet. The highest quality streams are those that begin in the Stirling Range National Park.
Much of the bed of the river and its tributaries is sandy in the upper reaches, but there are a number of long pools in the granitic rock of the riverbed in its lower reaches, which often hold water over summer.
There are no natural potable surface water resources identified in the Pallinup Catchment. All the streams of the catchment are brackish to saline with no prospect for development. There are also no groundwater resources identified for public water supply.
The Pallinup River starts on the almost flat Yilgarn Plateau, up to 300 metres above sea level, where much of the drainage is internal to salt lakes, some of which overflow and contribute to the river in very wet years. As the river descends to the coastal plain, the valleys become steeper and more dissected through the Pallinup Siltstone (spongolite) which overlays the ancient granites.
During the rapid agricultural expansion of the 1950s and 1960s, most of the catchment was cleared, with over 80% of the catchment today. It is estimated that during the January 1982 floods (caused by 200 mm of rain in two days) that 100,000 tonnes of sediment was discharged into Beaufort Inlet from the Pallinup River. Some of this sediment would have been deposited in the estuary, while much of the finer material would have been flushed out to sea.
It is assumed that sedimentation in the river and estuary has increased since clearing, but the rate of increase is unknown. Even if further loss of soil into the rives was stopped immediately, there may be sufficient loose sediments in the river-bed to contribute to estuary siltation for decades.
River water is saline, and the salinity has increased following clearing, most of which has taken place since the 1950s. Salinity now varies from about 10% of sea water (3-4 ppt) when the water is flowing, to 150% (over 50 ppt) in stagnant pools in the river bed in summer.
Aquatic flora and fauna
The Pallinup River is home to many native aquatic flora and fauna. Fish found in the Pallinup River include: Galaxias maculatus (spotted minnow), Leptatherina wallacei (western/Swan River hardyhead), Pseudogobius olorum ( Swan River goby), Gambusia holbrooki(Mosquito fish), Acanthopagrus butcheri (black bream). Gambusia is the only non-native species recorded in the Pallinup River.
Some aquatic plants sampled during the Department of Environment foreshore survey include the following: Cotula coronopifolia - which is a plant with small yellow button flowers. This species is found in areas which are frequently inundated, sometimes for long periods. It is an important plant for wading birds, particularly ducks and swans. Marsilea sp. (Nardoo) is another macrophyte found in waterways. It looks like a four leaf clover, but has a long single tap root, and floats on top of the water. It grows in seasonally flooded swamps and along creeks, and is very drought tolerant, dying away in arid conditions but growing back rapidly with rains. Aborigines used sporocarps of this plant for food (Nardoo). Juncaginaceae, Triglochin sp. - commonly known as 'water ribbons' were also found in the Pallinup River. These have tuberous roots that were used by Aborigines for food. The seeds germinate readily in the autumn in shallow water and the small plants survive the winter. This plant is very important for habitat for native fish and macroinvertebrates, and as food for wading birds. The plants will survive dry conditions by putting down underground rhizomes and tubers. They will only flower when they are flooded.
Wetlands in the catchment
There are two main wetland types in the sub-catchment including the Kojaneerup suite and the Manypeaks suite of wetlands. Several of the larger (unnamed) wetlands of these suites are considered regionally significant, due to the valuable fringing remnant vegetation, and habitat and refuge they provide for waterbirds and other fauna.
The Kojaneerup suite wetlands are large open salt pans that lie south/south west of the Stirling Range. They have formed on alluvial fans at the base of the ranges and have small drainage lines flowing into them from the range lowlands. Surrounding vegetation is commonly samphire, sedgelands, salt paperbark Melaleuca cuticularis and yate Eucalyptus occidentalis. Water quality ranges from naturally brackish to increasingly saline, due mainly to saline groundwater discharge. A unique feature of these systems is the gypsum sediments that underlie the basins that has precipitated from this groundwater
The Manypeaks suite is spread across a wide area with several wetlands in this catchment. This suite is characterised by isolated basins covered with stands of yate, often fringed by salt paperbark. The basins have formed over impermeable sediments where fresh surface water run off has collected and formed seasonal freshwater sumplands. Rising groundwater in the catchment has degraded many of these wetlands and turned them increasingly saline, with small belts of fringing vegetation often the only healthy vegetation remaining.
In the Pallinup-Stirlings subregion, there is also a broad system of lakes north-west of the Stirling Range including a series of floodplain wetlands associated with the Pallinup River. The Middle and Upper Pallinup Wetland group includes wetlands on broad floodplains on the middle and lower Pallinup River and major tributaries. A narrow corridor of remnant vegetation occupies the valley floor of the river in many sections, but in others the river is heavily salt effected and eroded, placing the wetlands in C or D grades.
The North Stirlings Wetland Group - includes large areas of internal drainage in the south-west corner of the Pallinup catchment, known as the Balicup wetland suite. This group of wetlands are remnants of an ancient watercourse believed to be a former channel of the Pallinup River. Rising sea levels filled the valley with marine sediments and created the chain of basins found today. The wetlands include many mainly dry and intermittent lakes and some permanent lakes including Tom South, Munrillup, Horse Shoe, Balicup, Anderson, Cheepanup, Camel and Salt Lakes.
Nearly all of the private land is cleared with most of the lakes retaining only a degraded narrow fringe of remnant bush. As a result, most wetlands range between lower C and D grade with only those within or on the edge of the more substantial nature reserves being B grade (including Anderson and Camel).
The Balicup Lake system is however extremely significant and considered to be of national importance, and is listed on the national "Directory of Important Wetlands in Australia". Lakes Cranbrook, Anderson and Camel are monitored by CALM. All three are hypersaline but vary in their level of flooding and extent of fringing vegetation. Most wetlands in the catchment are at risk from salinity and waterlogging.
Overall condition
The Pallinup River and other waterways in the catchment are showing signs of degradation similar to other rivers in Western Australia. In particular, the riparian vegetation is degrading due to stock access, salinity, waterlogging and weed invasion. Catchment changes including rising groundwater levels, increasing salinity and nutrient levels draining from the catchment are impacting on the health of the waterways in the subcatchment and ultimately the Pallinup River and Beaufort Inlet. There are weeds proliferating along the Pallinup River and the river is coping with increased volumes of water coming off a catchment that is cleared, resulting in unstable banks and subsequent erosion and sedimentation of river pools. There has been two major flood events recorded on the Pallinup River including the 1955 flood and the 1982 flood. Both floods caused considerable damage to the riparian vegetation along the river, and resulted in considerable bank damage and subsequent sedimentation of many river pools.
The Water and Rivers Commission conducted a survey of the Pallinup River from Beaufort Inlet to south of Gnowangerup and the Pendernup Creek as part of the Pallinup River Action Plan in 2000/2001. The survey recorded foreshore vegetation condition, habitat values, pool locations and condition, channel stability and sedimentation. The Action Plan also collected information pertaining to the river and estuary including water quality, native fish, macroinvertebrates, and historical information.
Stream sections that could be considered outstanding are the upper reaches of the Monjebup Creek, Corackerup Creek, Peenebup Creek and Pendenup Creek, and sections of the Pallinup River from Borden to the Beaufort Inlet. The highest quality streams are those that begin in the Stirling Range National Park. The Corackerup Creek and Peenebup creek have been identified as macrocorridor projects in the CALM macrocorridor project as they link the Stirling Range National Park to the Fitzgerald River National Park. These tributaries are extremely important to protect in the long term.
The survey recorded sections of the lower Pallinup River in excellent condition. In particular, the river south of Chesterpass Rd was graded as A and B grade condition. Many sections of the river north of the Chesterpass Rd are graded as C grade. Here the banks were actively eroding and the understorey is damaged by stock and weed invasion.
Water and Rivers Commission also surveyed Pendernup Creek in 2000. The survey results indicate that the Pendernup Creek is in good to excellent condition. The riparian corridor is generally has vegetation in good condition, with a few sections showing degradation due to stock access, salinity, waterlogging and weed access.
| Waterway component | Rating | Comment |
|---|---|---|
| Hydrology and water quality | 4 | Water quality indicates high nutrient levels, increased salinity levels and an increase in flow from a clearly catchment. Evidence of eutrophication in Beaufort Inlet. |
| Foreshore vegetation | 4 | Good condition in the lower, poor in the upper. Excellent along Corackerup, Pendernup, Peenebup and tributaries draining off the Stirling Ranges. |
| Aquatic vegetation | 3 | Many pools in the lower section have various aquatic plants. There are some pools with increased algae and epiphyte growth - indicating high levels of nutrients. |
| Aquatic habitat | 3 | Good habitat, many pools, riffle zones and overhanging vegetation. Stock access and salinity are compromising some of these values. |
| Bank stability | 4 | The river is showing signs of instability from increased catchment flows. Considerable damage was done in the 1955 and 1982 flood events. |
| Channel features and modifications | 2 | Few modifications except some farm dams on tributaries. Most of these have gone saline since. |
| Other pollutants | Unknown | Not monitored. There are community concerns about pesticides. |
| Cultural, historic and cultural values | 3 | High recreational use, commercial fishing, recreational fishing, popular camping ground. The Pallinup River is important for Indigenous Australians. |
| Conservation values | 2 | High conservation values. Extremely rich botanical area surrounding Beaufort Inlet. Pallinup River and some of the tributaries form important vegetative corridors in the South Coast Region. |
|
||
Flow records from the Pallinup River between 1973 - 1982 recorded the average flow of 17.6 million cubic metres. The average annual flows can be misleading because of the great range of annual flow (56.4 million cubic metres in 1978 and 4.3 million cubic metres in 1980). In many cases storm events distort the average volume of flow. The January 1982 flood accounted for %90 of the year's flow of 53.2 million cubic metres.
The following graph demonstrates flow rates 1974 - 1995. The following graph shows yearly river discharge in Gigalitres (GL), for the Pallinup. These figures come from the Bull Crossing stream gauging site, near the junction of the Corackerup Creek. As a rough guide, one GL is equivalent to the capacity of about 500 olympic swimming pools. More detailed investigations of the run-off record suggest that run-off from the Pallinup catchment happens more readily than for some of the other south coast rivers such as the Kalgan.
 Water and Rivers Commission conducted more intensive sampling in the catchment from 1998 - 2000. The following information summarises the data collected. The map shows the location of the various sites where monitoring was undertaken. This data provides a picture of the Character of the Pallinup River. Water quality is strongly linked to stream flow levels, therefore rainfall information is important when considering what the water quality data is suggesting.
| The middle 50% of readings lie in the range shown by the darker colour band | The middle 80% of readings lie in the range shown by the lighter colour band |
 |
 |
 |
 |
Differences are shown for the winter and summer pattern of nutrients
 |
 |
 |
|
Dissolved oxygen levels were generally quite acceptable with 38% of the measurements between 7.5 and 10 mg/L. Low values, that could be of concern for aquatic life, occurred for about 5% of the readings. High values are often associated with algal growth although some of the microscopic organisms can quickly reduce DO levels in the water. Low DO accounts for many of the fish deaths that have occurred in the Beaufort Inlet. pH values were consistently alkaline, between 7 and 9.
Recommendations
Recommendations
Recommendations
Recommendations
Recommendations
Recommendations
Recommendations
Recommendations
Recommendations
Recommendation
Recommendation
Further Information:
Romanowski, N. (1998) Aquatic and Wetland Plants. Sydney: UNSW Press.
Hodgkin, E.P. and Clarke, R. (1988) An Inventory of Information on the Estuaries and Coastal Lagoons of South Western Australia. Estuaries of the Shire of Jerramungup. Environmental Protection Authority, WA. Estuarine Studies Series 4.