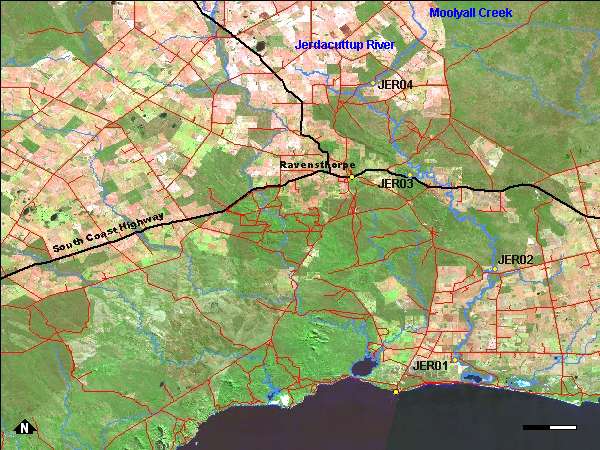
Four sites were sampled on the river; they are shown on the map above. Photographs are available for each site:
| JER01 | JER02 | JER03 | JER04 |
Site JER01 and JER03 were considered degraded with weeds making up most of the understorey. JER02 and JER04 were in better condition with less weeds and healthier native vegetation.
The temperature of the water at the sites ranged from 18.14 to 20.43°C.
Salinity was highest at site JER03 on Cordingup Creek at 44.94ppt (saltier then seawater which is about 35ppt). The remaining sites had salinity increasing upstream from 12.08ppt at the lowest site to 17.76ppt at the most upstream site JER04.
The water ranged from 6.77 to 8.17 in pH which suggests it is close to neutral (pH 7) to slightly basic.
The greatest total phosphorus levels recorded along this river was 24 µg/L at Cordingup Creek with the remaining sites from 13 to 16 µg/L. These levels are quite low compared to some of the other rivers sampled as part of this project. For total nitrogen the most upstream site on the Jerdacuttup River had the highest level at 2800 µg/L with the second highest the Cordingup Creek. The lowest site (JER01) had the least nitrogen at 790 µg/L.
